COMMODITIES
INDICES
Trading Secrets
WD Gann was born on June 6, 1878. As a finance trader, he started his trading career in 1902 when he was 24. He devised numerous trading techniques to forecast market trends. His famous soyabean trade shows his ability to use planets (Jupiter & Mars) to forecast top in Soyabean. One of our advance Course explains his secret techniques to forecast market moves. These are only taught to students who have successfully completed master trading course and have proved worthy of learning this unorthodox science
Welcome to WISKEIN
Value of Technical Analysis
Profitable speculation and investment in stocks, commodities, indices or currencies is principally dependent on how comprehensive a grasp the decision maker has of technical and fundamental factors at work within the market. All the luck in the world cannot substitute astute technical and fundamental knowledge imperative for profitable decision making. When investing or trading without such knowledge trader or investor in greater or lesser degree is only a gambler naively. When it comes to timing your trade or working out price resistance or support, technical factors will supersede fundamental factors such as earnings, debts, future profitability etc. We understand how suicidal market shouts, rumor and news can be, with the methods explained in our trading course you will never lose sight or miss an opportunity.

Correcting the misconception
Does Big Players Really Manipulate Prices
To correct a common misconception, no rigger or pool will meet success by bucking the general trend. Market move in waves of times against the wishes of the majority or in spite of every human effort to serve the trend. The explanation of this condition lies in those natural laws which are related and are part of the cyclical movement of mass psychology. It is in examination of these natural cycles that both individual speculator and the managers of large funds can locate the key to the many inexplicable market trends. History repeat in cycles which is why prices rise and fall, markets makes high at certain dates and then shifts trend to move lower till a mathematical point is reached or sufficient time has expired. Time is however the most important factor that bring about a change. Nothing stands still – everything is being born, growing, dying – the very instant a thing reaches its height, it begins to decline – the law of rhythm is in constant operation.
Market geometry
Pythagorean Proposition
A Pythagorean proposition is that all things consist of the three-the trinity of proportions or the arithmetical, geometrical and harmonical. In market terms this is a clue to the relationship which exists between the angles of lift in charted prices and the extent or time of market activity is days, weeks, months etc. Pythagoras taught about numerical relation in all the phenomena; the harmonic intervals of numbers with sound; the relationship that the square of hypotenuse in a right handed triangle is equal to the sum of the square on the other two sides and more importantly the angles of the sphere have specifically corresponding numbers which are sensitive to those angles in space, infinity and time. The lift of charted prices does coincide with numbers at specific points in space corresponding to price and time. In these observations is the entire basis on which we evaluate every stock, commodity, indices or currency.
following the law is important
Compliance with the Law of Nature
Universe and whatever exits within its realm is govern by laws. Anyone who will try to go against these laws will fail, he will never succeed in any line of business. Price rises with the increase in demand. No one can change this because law of supply and demand will remain same forever. Price swings or moves resembles that of a swing of a pendulum from inertia, through energy and back again to inertia. It is but a series of opposing pulsation and reaction, integration and disintegration, gravitation and radiation, appearance and disappearance , Low price and High Price. The average man or women nearly always wants to buy low and sell high. The farmer wants to sell at high prices what he produces but he wants low price for what he buys to eat or wear. The laboring man wants high wages all the time but wants low prices for what he buys to eat or wear. This is a violation of a fundamental economic law and it just will not work. To make success in speculation you do exactly the opposite of what the average man or women wants to do or tries to do and make a failure as a result of what they are trying to do. You will make profits when you learn to BUY HIGH AND SELL LOW. You must learn to follow the trend of prices and realize that they are never too high to buy as long as trend is up and never too low to sell as long as trend is down.
Resistance & Support
Timing is the key
Resistance and support should be calculated for both price and time By the help of time cycles, geometrical angles, mathematical retracement and squaring of price with time one can analyze when there is a possibility of minor and major trend reversal. Time factor will surpass price and therefore timing is the key to success.
Know the direction
Market cycles
W.D Gann, George Bayer, Larry Pasavento, Michael Jenkins and many other prominent trading figures have talked about time cycles and law of vibration for forecasting market moves. Studying historical data is pivotal for forecasting future market trends. Remember history repeats in cycle and these repeated cycles are the real cause behind rising and falling prices of stock or commodity.
Sharing KNOWLEDGE
Say no to Gambling
We drive our greatest satisfaction by promoting technical knowledge and organizing investor awareness sessions that enables them to manage risk and make knowledge based trading decisions. Remember trading without technical knowledge is gambling which puts your capital at risk. Say NO to gambling with Wiskein.
Once you master to analyze your daily, weekly and monthly chart you will see how easy it is to evaluate trends in stocks, commodities, indices and currencies. You will become independent and will no longer be distracted with news, rumors and personal opinions.
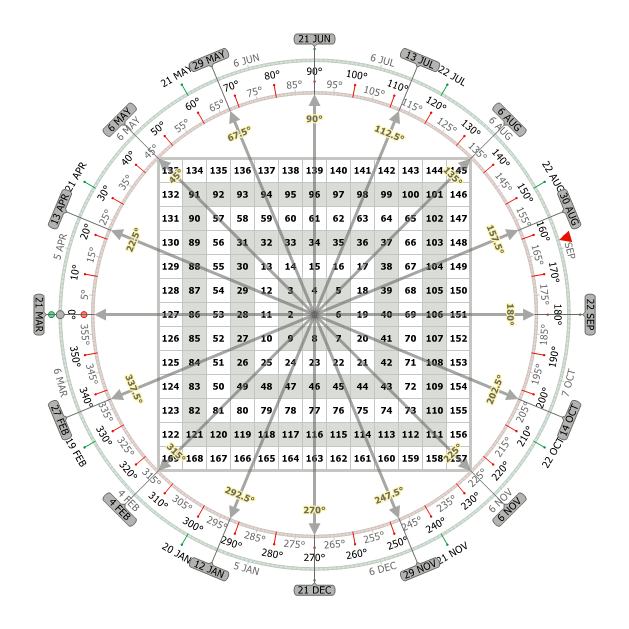
Square of 9 and Circle of 360 Price & Time calculator
One year cycle of 365.25 runs very close to 360 degree cycle of sun around the constellation of zodiac. 360 degrees can be further divided to reach smaller harmonic divisions within the cycle such as 90,180,270. So if a rally starts around 21st March 90 degree in time would be around 21st June which is its first resistance in time. Square of nine calculator has all even and odd square running on opposite angle which can be used to calculate price or time resistance. Rate of vibration can be calculated from how many degree price has moved in certain period of time measured in days, weeks or months.
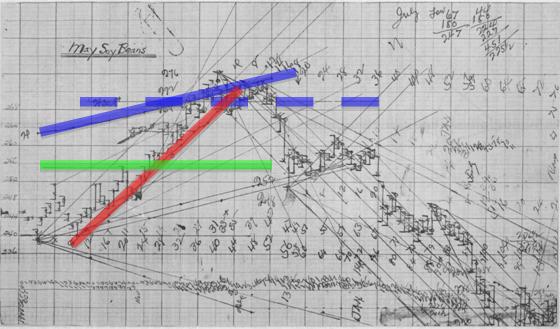
W.D.Gann famous Soya Bean Chart
W.D.Gann was using planetray lines to predict future prices. Above image shows how he plotted Jupiter and Mars planetray lines on Soyabean chart to calculate exact top in Soyabean.
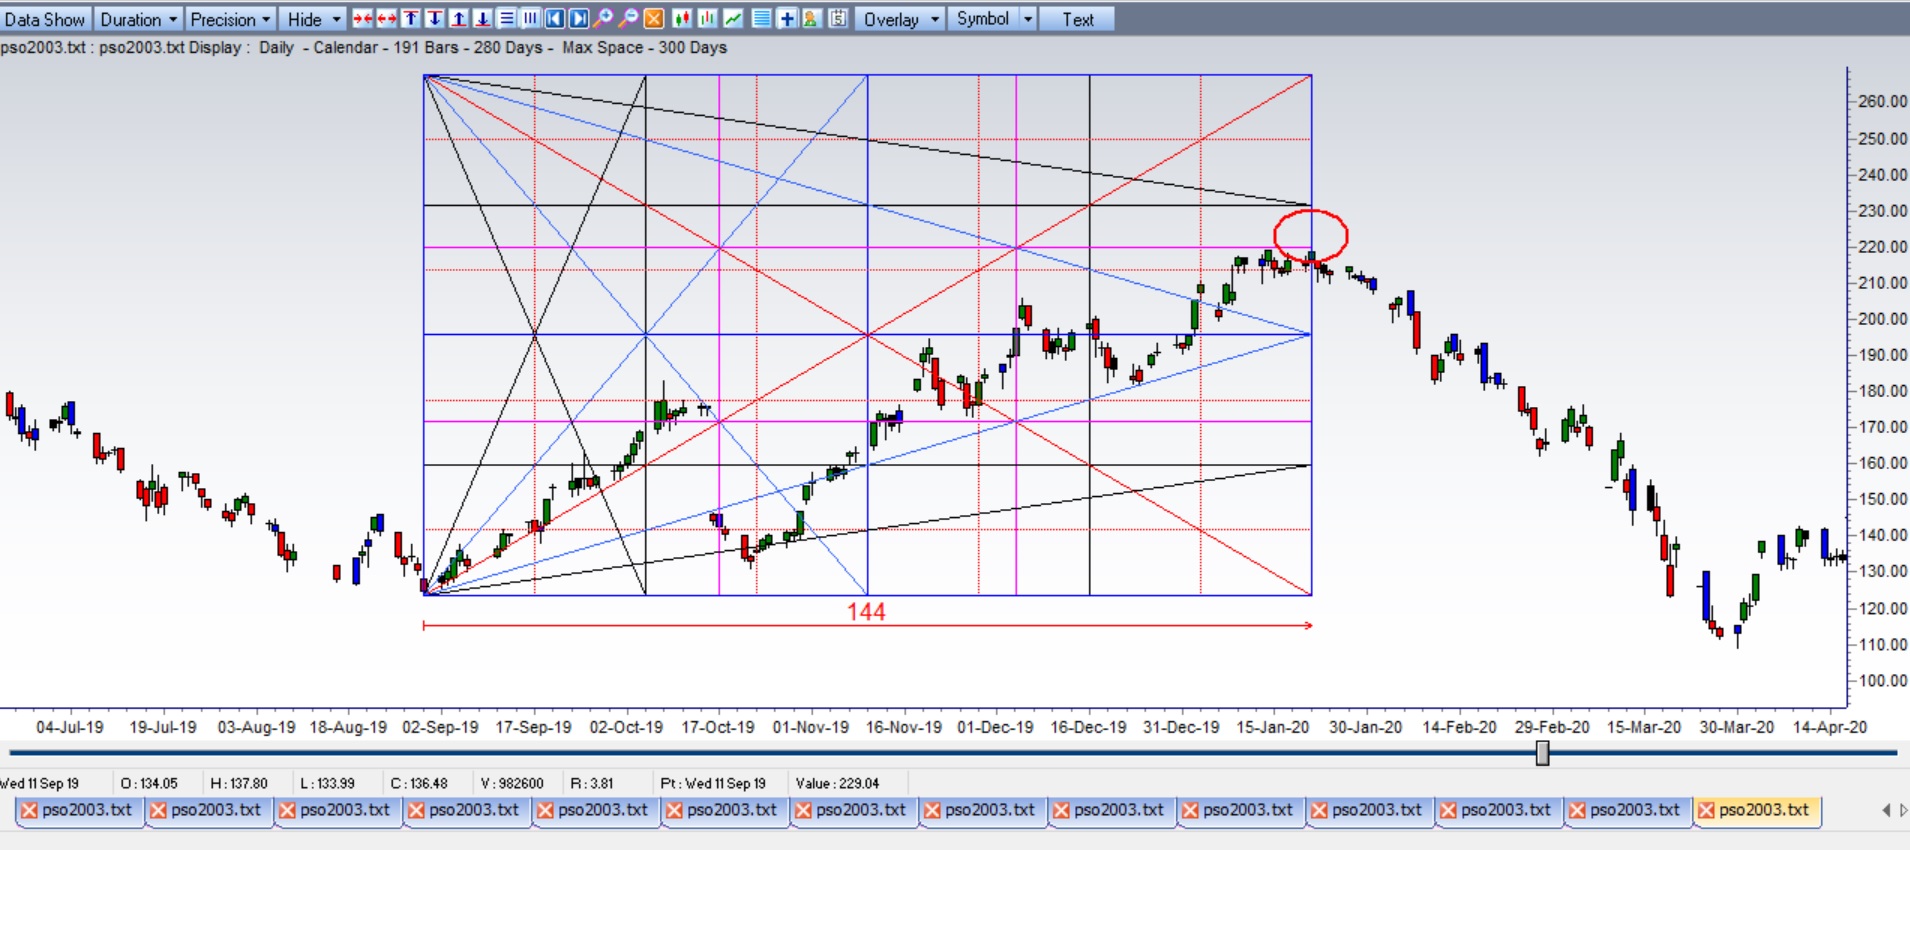
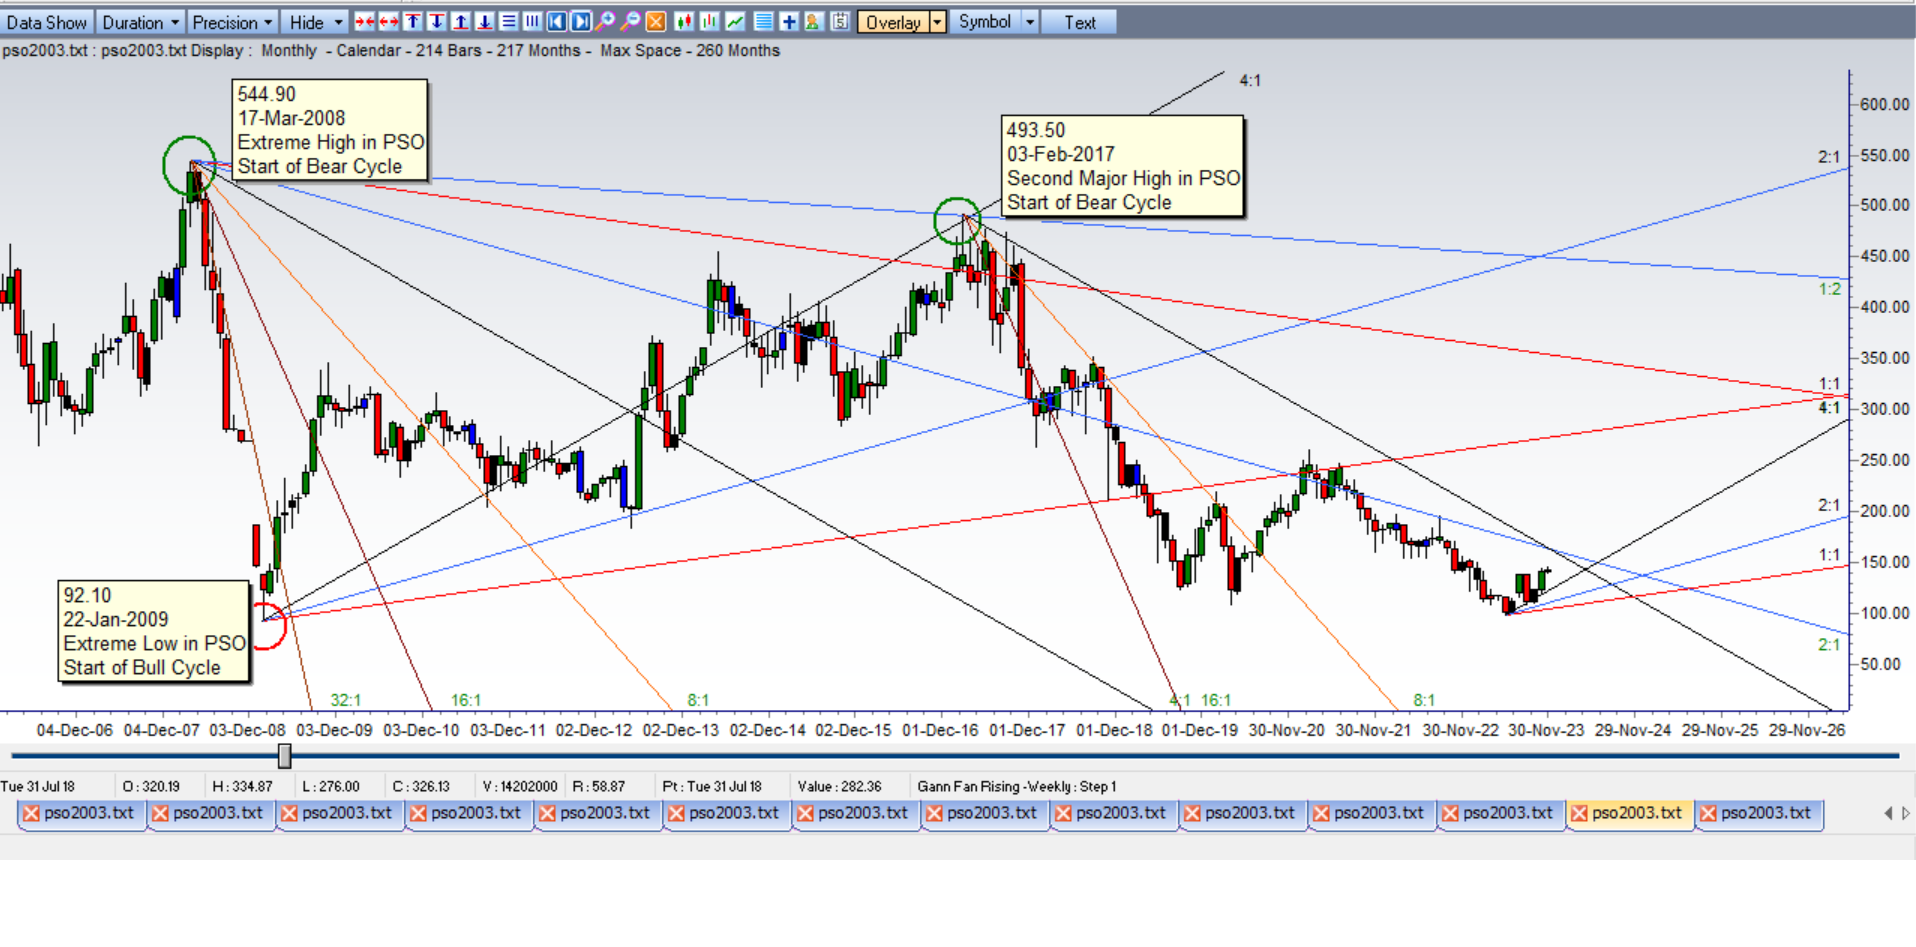
144 Time Cycle applied to Stock (PSO,Pakistan Stock Exchange)
Above chart shows 144 time cycle applied to a stock traded in Pakistan stock exchange. Observe on the chart that when 144 days time cycle expires at a price difference of 96 which is a 2/3rd or harmonic number to 144 PSO stock starts to decline, shifting its trend from bullish to bearish. Actual cause of rise and fall in every stock or commodity is primarily due to these repeated cycles.