COMMODITIES
INDICES
ASL AISHA STEEL MILLS LIMITED
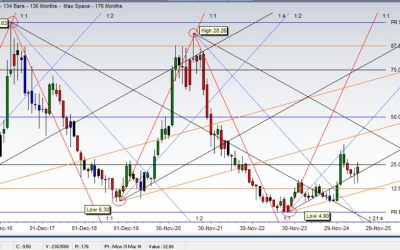
ASL (Aisha Steel Mills Limited) Technical Analysis Feb 2017 high 29.63 Sep 2023 low 4.90 High low...
AISHA STEEL MILLS
ASL (Aisha Steel Mills Limited) Technical Analysis Feb 2017 high 29.63 Sep 2023 low 4.90 High low...
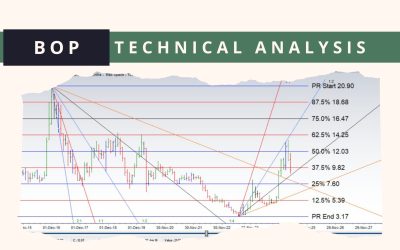
BOP Technical Analysis
BOP price range on monthly chart: 17.73 BOP price range on monthly chart: 17.73June 2023 Low...