by admin | May 30, 2025 | Analysis
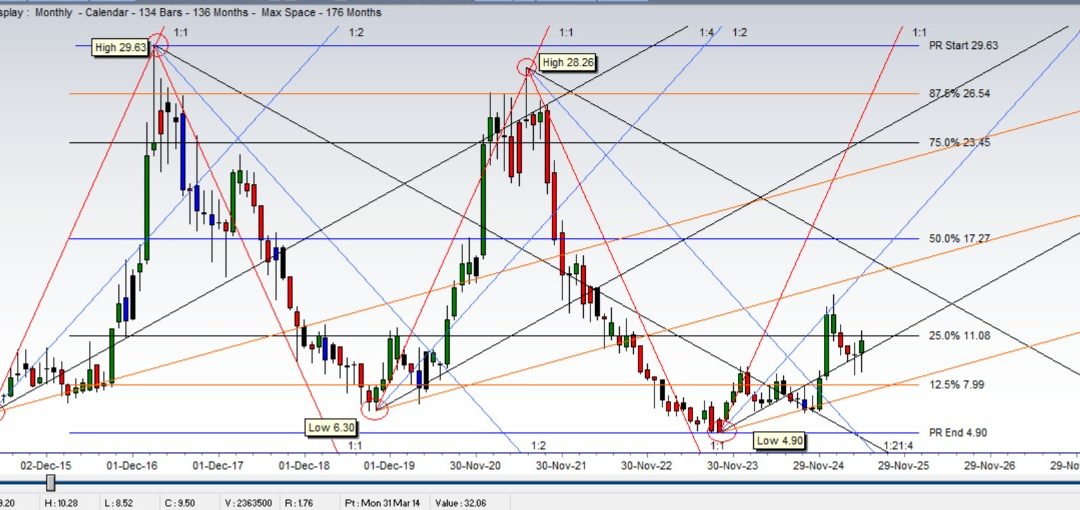
ASL (Aisha Steel Mills Limited) Technical Analysis Feb 2017 high 29.63 Sep 2023 low 4.90 High low range is 24.75 most important resistance resides at 50% or price level of 17.27 On monthly chart 1:8 angle drawn from 4.90 low is strong support angle implying price...
by admin | May 30, 2025 | Analysis
ASL (Aisha Steel Mills Limited) Technical Analysis Feb 2017 high 29.63 Sep 2023 low 4.90 High low range is 24.75 most important resistance resides at 50% or price level of 17.27 On monthly chart 1:8 angle drawn from 4.90 low is strong support angle implying price...
by admin | May 8, 2025 | Analysis
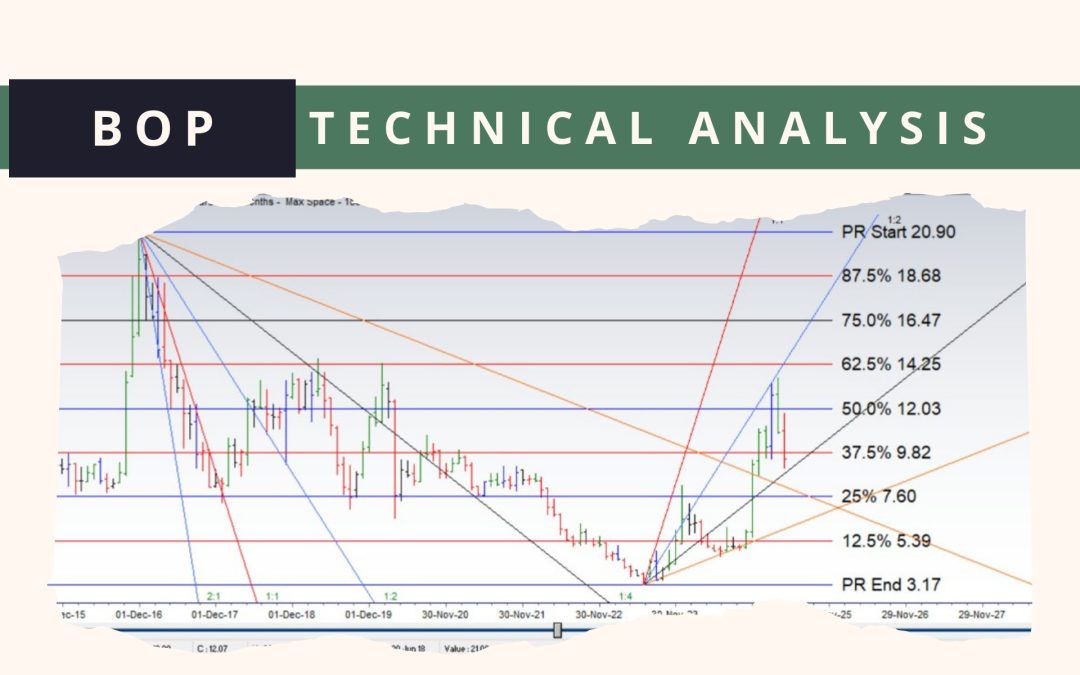
BOP price range on monthly chart: 17.73 BOP price range on monthly chart: 17.73June 2023 Low 3.17November 2016 High 20.90(20.90-3.17=17.73)50% of this Range was at 12.03As a normal rule, when stock reaches 50% of its range for the first time, it bounces back for a...