by admin | May 30, 2025 | Analysis
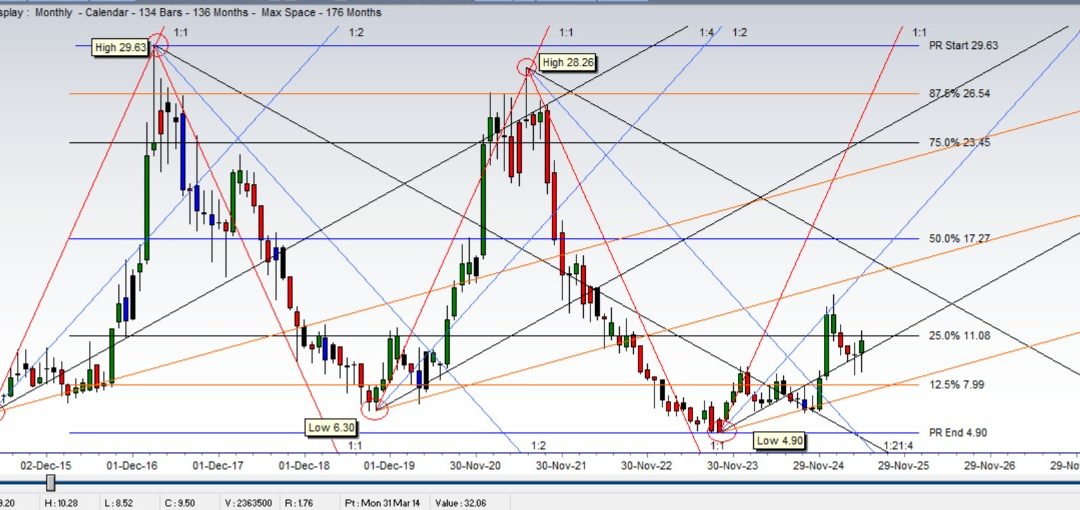
ASL (Aisha Steel Mills Limited) Technical Analysis Feb 2017 high 29.63 Sep 2023 low 4.90 High low range is 24.75 most important resistance resides at 50% or price level of 17.27 On monthly chart 1:8 angle drawn from 4.90 low is strong support angle implying price...
by admin | May 30, 2025 | Analysis
ASL (Aisha Steel Mills Limited) Technical Analysis Feb 2017 high 29.63 Sep 2023 low 4.90 High low range is 24.75 most important resistance resides at 50% or price level of 17.27 On monthly chart 1:8 angle drawn from 4.90 low is strong support angle implying price...
by admin | May 8, 2025 | Analysis
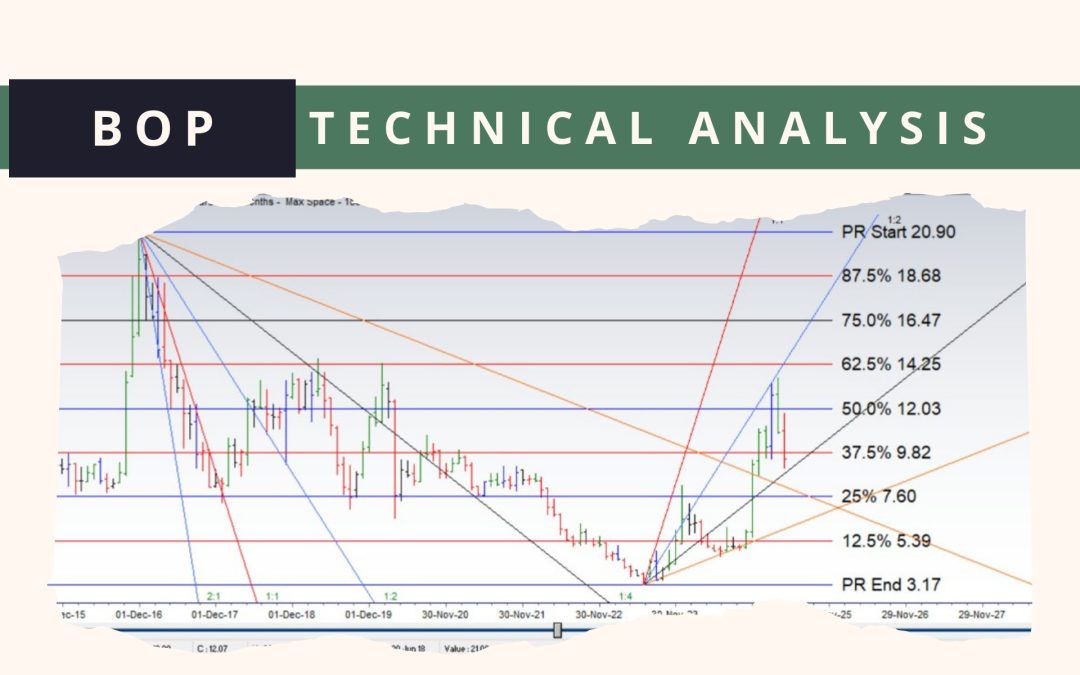
BOP price range on monthly chart: 17.73 BOP price range on monthly chart: 17.73June 2023 Low 3.17November 2016 High 20.90(20.90-3.17=17.73)50% of this Range was at 12.03As a normal rule, when stock reaches 50% of its range for the first time, it bounces back for a...
by admin | Nov 21, 2023 | Events
Monthly and Weekly meetups where traders, investors and students share technical analysis and highlight future opportunities in Stocks and commodities. Fundamental and technical discussion are beneficial in gaining knowledge about present and future market trends....
by admin | Apr 27, 2020 | Commentaries - Stock (PSX)
The Stock Market Crash of 1929 It began on Thursday, October 24, 1929. 12,894,650 shares changed hands on the New York Stock Exchange-a record. To put this number in perspective, let us go back a bit to March 12, 1928 when there was at that time a record set for...